Tailings Pipe Risk Improvement Solutions
Overview:
Our new senior reliability specialist was a key player in developing improved tailings pipe risk improvement strategies for over 100Km of tailings piping at Albian Sands Mine and through continuous improvement, helped save over $18million in reduced piping integrity failures in 2018.
Challenge:
Taking manual measurements of surfaces, such as with a pit gauge, is time consuming and operator dependent. The measurement results can vary from user to user and from inspection to inspection. Inspectors need a more reliable method for a faster, more efficient inspection. The use of lasers to measure external corrosion requires a major investment in equipment and training. Furthermore, laser inspection is incapable of providing a complete assessment of pipe integrity as it cannot reach the pipe’s internal surface. This limitation means that laser inspection must be supported by more than one system/technology, which can lead to training, data management, and inspection team coordination challenges. Global’s PSP provides optimum near-surface resolution, precision measurements, and an enormous improvement in flaw characterization over conventional Ultrasound.
Solution
Global’s Automated PSP is designed to offer the best inspection solution for the detection of wall-thickness reductions due to corrosion, abrasion, and erosion. Our solution also detects mid-wall damage such as hydrogen-induced blistering or manufacturing-induced laminations, and easily differentiate these anomalies from loss of wall thickness.
External corrosion can be mapped at the same time as internal corrosion (remaining wall) in one scan. The first group is optimized for internal corrosion while the second group (using the same probe) is optimized for external corrosion mapping. This provides two distinct C-scans that can be analyzed directly on the instrument, on a computer using the software, or exported independently in CSV format. Spreadsheet software can then be used for post-processing.
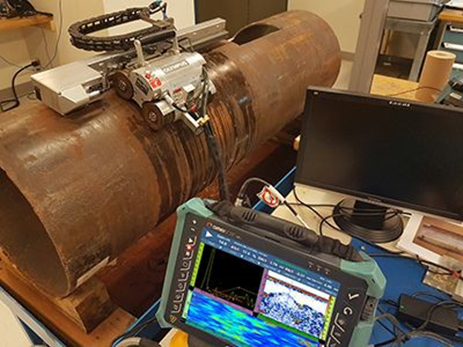
Figure 1: Inspection of a 20” pipe
Corrosion Data on a Corroded Sample
The tested sample was a 20 in. (508 mm) OD pipe with a nominal wall thickness of 0.35 in. (9 mm) with corrosion on the inner and outer surfaces. The scan was performed on the circumferential axis on the outside diameter using an assembly consisting of the scanner and automated scanner. The surface was covered with a resolution of
1 mm × 1 mm.
S-scan and C-scan views were used to visualize the corrosion. The first group’s C-scan (Fig. 2) was used to visualize the remaining wall value, considering the internal corrosion. The blue color in the C-scan represents the nominal thickness, and the remaining wall becomes thinner as the color progresses from yellow to orange to red. In the C- scan, there are four areas where we can identify noncoherent data. These areas represent where the external corrosion disrupts the signal.
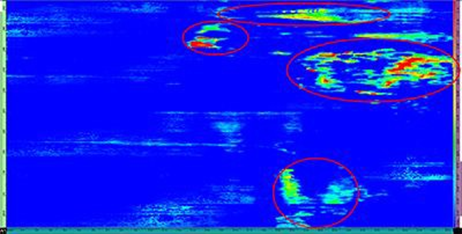
Figure 2: Remaining Wall C-Scan with Signal disrupted by the external corrosion
With the second group, we can see the external corrosion in both the S- scan (Fig. 4) and C-scan (Fig. 3). For this example, which uses a custom color palette (a typical corrosion inspection palette), the redder the color, the deeper the external corrosion. The external corrosion is easily identifiable, and it correlates with the remaining wall C-scan acquired by the first group.
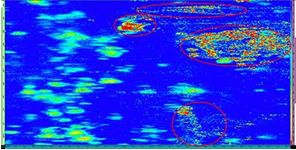
Figure 3: External corrosion C-scan with the Scanner
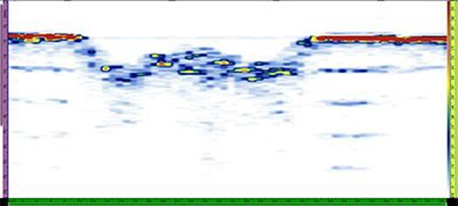
Figure 4: S-scan example of external corrosion acquired with the scanner
Conclusion
With this new inspection procedure, external corrosion can now be mapped during a typical internal/remaining wall corrosion inspection. A second group optimized for external corrosion measurement can be created using Global’s Phased Array instrument. External and internal (remaining wall) corrosion data can also be exported to a CSV file for further analysis. The data is updated as inspection occurs. This method can reduce the time it takes to perform corrosion inspections and avoid the investment required when multiple inspection technologies are used.
This supports the strategy for improving how, when and where piping sections are replaced and/or upgraded.
Once the initial inspection is completed, we would have a base line with ‘spools of concern’ identified whereby we would need to go back and check them periodically (because they are thinner than we would like) and then in 2-3 months (or less) go back and do it all again to get an erosion rate assessment.
That way, we would be able to give the client an up to date threat report on their piping and then in 2-3 months be able to help advise on rotation and/or replacement strategies.
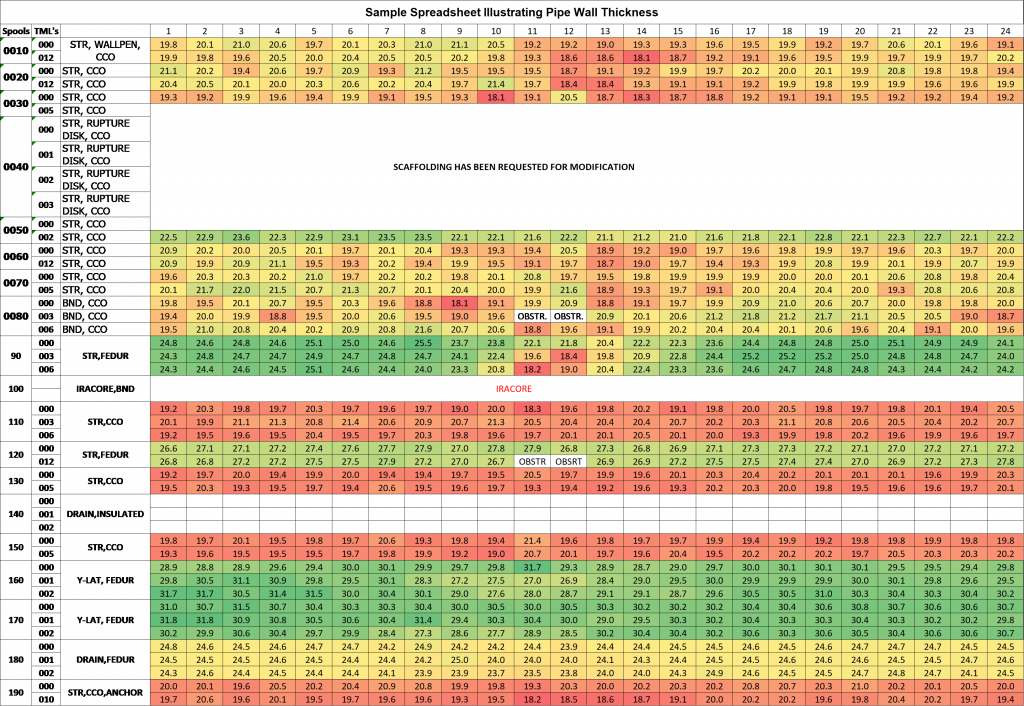
This data is easily uploaded into a CSV format (above) and can be easily updated after each survey.